Sample Student Work
TinkerPlots™ has been extensively field-tested with students from US grades 4–8. Here is some sample work from seventh graders at a TinkerPlots test site, on an activity included with the software.
A Backpack Problem
Some doctors believe that heavy backpacks are responsible for an
increase in back problems among adolescents. The field-test students
explored data about students in grades 1, 3, 5, and 7 to decide which
students carry the heaviest backpacks.
Building a Graph with TinkerPlots
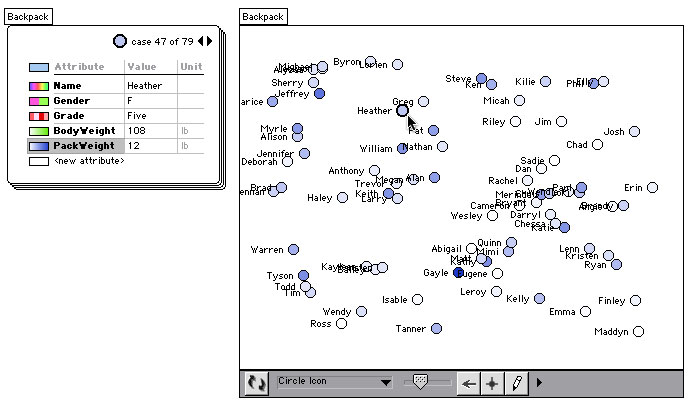
Data icons first appear in a haphazard arrangement in the plot
window. The icons are colored along a gradient for the variable selected
on the data card, in this case PackWeight. The bluer the icon, the heavier the backpack. Clearly, the heaviest backpack belongs to Gayle.
You can see Heather's data card (above, upper left), and her data
icon in the plot window (right). Dragging the data icons separates them
into groups.
Students can further use controls to stack, order, separate, fuse, or display icons as value bars.
Here are the routes taken by three pairs of seventh grade
students in exploring the relationship between backpack weight and
grade:
Sample Student Work: Pair 1
Sample Student Work: Pair 2
Sample Student Work: Pair 3
|

